Analytics

Overview
The Analytics view gives you a total overview of app installs, usage time and organization related information.
To view more detailed statistics for each app, use the App Overview view.
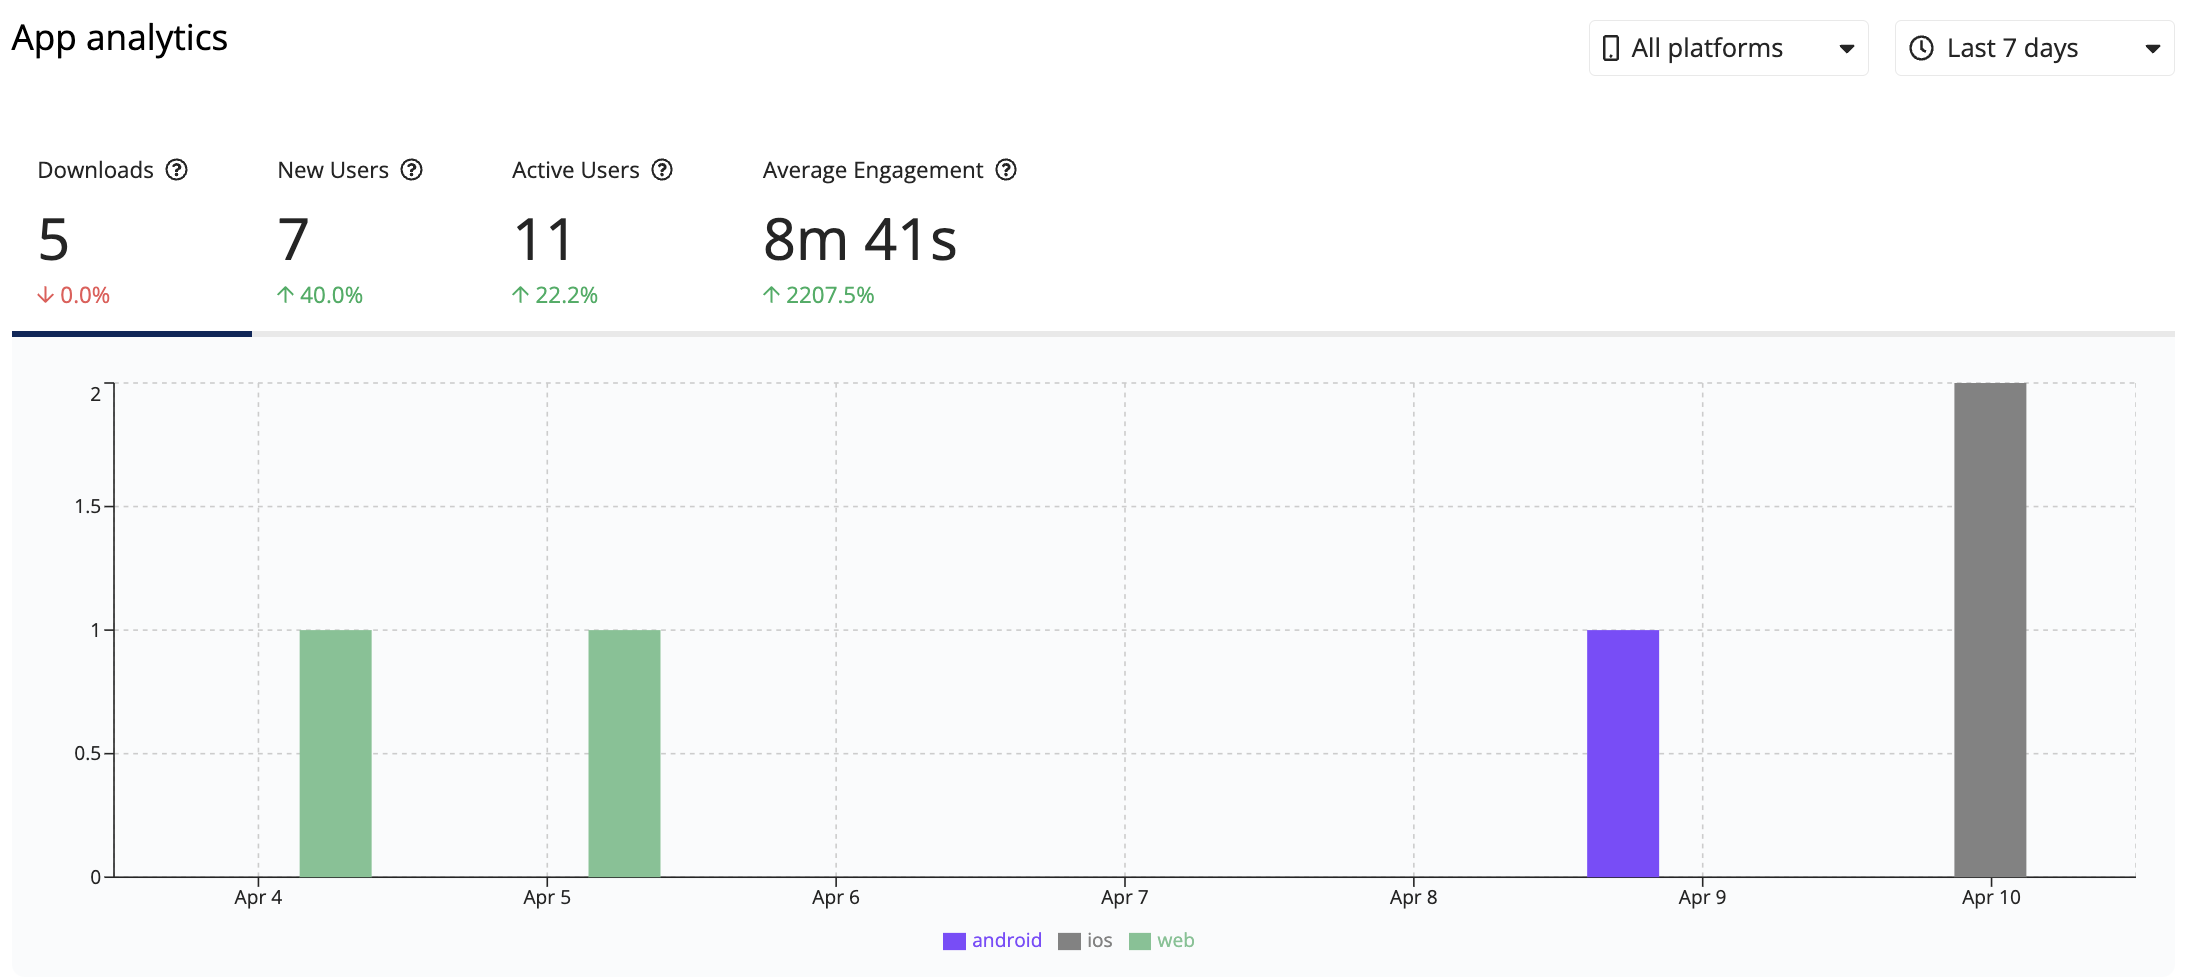
Downloads
The number of published apps, per platform, over a selected time period. You can select the time period in the top right corner of the chart.
New Users
This number is the sum of registered and anonymous users. The graph provides a breakdown by day for the selected time period